New Data is Key to Anti-Bribery, Anti-Corruption Efforts
TRACE International published an updated Bribery Risk Matrix earlier this month, and the rankings will be hugely informative in corporations’ business dealings across the globe. Clifford Chance’s Wendy Wysong and Nick Turner discuss.
with co-author Nick Turner
Gut instincts can be good when undertaking an anti-corruption risk assessment on an Asia-Pacific business opportunity. But even better is data obtained from leading public interest and international organizations, including the United Nations, the World Bank and the World Economic Forum, analyzed by experts in the fields of political science, economics and corruption studies and presented in a detailed publicly available matrix.
The 2018 TRACE Bribery Risk Matrix, published online in early December, provides such data in the form of a detailed database that can be used as a basis for a company’s decision to approve a deal in Malaysia, conduct deeper due diligence in, say, Vietnam than Nepal and allocate scarce compliance resources in, say, China rather than India. For compliance and due diligence purposes, this kind of data is indispensable and provides an objective foundation for market-wide expectations and risk-based practices, which is good for business and helps promote the anti-bribery, anti-corruption mission in Asia-Pacific and globally.
The TRACE Matrix scores and ranks each of 200 countries for business bribery risk, based on data from over 50 sources. It categorizes the risk level of each country as: Very Low (i.e., New Zealand, Singapore, Hong Kong and Australia), Low (i.e., Taiwan, South Korea, Japan and Bhutan), Medium (e.g., Malaysia, India, Nepal), High (e.g., Vietnam, China, Myanmar, Cambodia) and Very High (i.e., North Korea).
Published and refined since 2014, the TRACE Matrix provides a valuable analytical tool for measuring bribery risks for commercial decision-making and developing risk-based compliance solutions. The TRACE Matrix also provides its underlying analysis for those figures. It looks at four risk “domains,” including:
- business interactions with government (opportunity),
- anti-bribery deterrence and enforcement (deterrence),
- government and civil service transparency (transparency) and
- capacity for civil society oversight (oversight).
These domains are further broken down into nine “subdomains.” For example, the oversight domain will look at a subdomain for a free press.
These underlying domain analyses mean that a country such as Vietnam can rank as medium risk for business interaction with the government, enforcement and transparency, but high for oversight, which gives it an overall high-risk score. If medium risk for bribery opportunities (domain 1) is within a company’s risk appetite, it would make sense to move forward (with appropriate compliance measures), even if the overall risk score is high.
As the case of Vietnam makes clear, the five risk-level categories and underlying analyses provide a nuanced approach to risk assessment. Transparency International (TI) also scores and ranks countries, based on the perception of public sector corruption. The TI Corruption Perception Index (CPI) differs from the TRACE Matrix in that the latter focuses on business bribery risk, as opposed to the CPI’s public sector focus. Moreover, the CPI does not provide the data underlying the scores and ranks and uses fewer data sources. Finally, the CPI uses three categories of risk so that Malaysia, while occupying roughly the same rank on both the Matrix and the CPI, is categorized as medium risk by TRACE and high risk by TI. (The 2018 CPI has not yet been published).
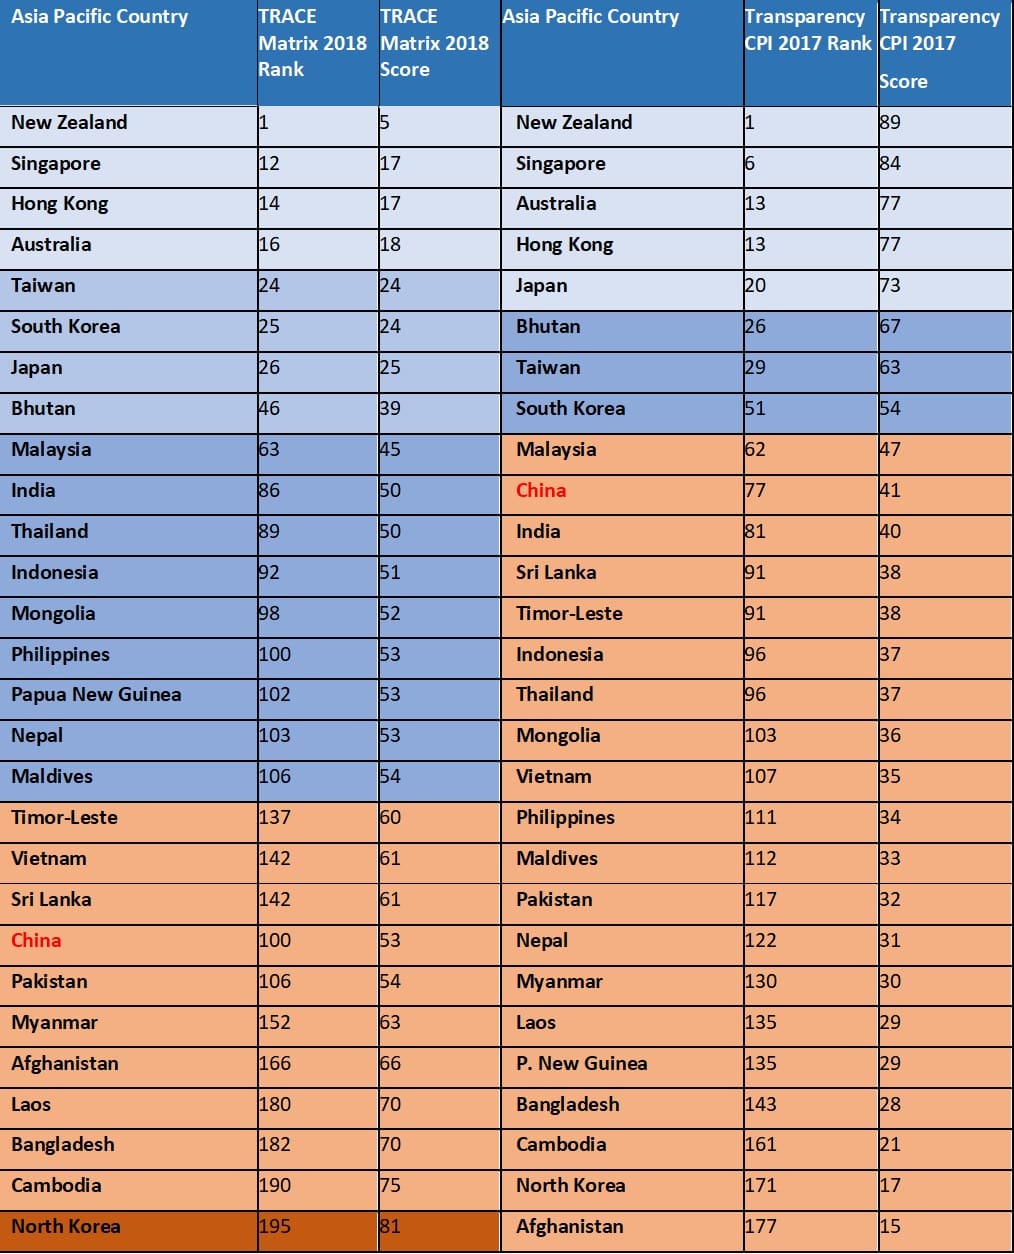
As illustrated in the attached chart comparing the 2018 TRACE Matrix results with the 2017 CPI results for a selection of Asia-Pacific countries, despite the different focus, methodology and details, the two databases make roughly the same assessments at the bottom and top of the list. But there are more Asia-Pacific countries categorized as low and medium risk by TRACE – about 20 of 34 on the complete list – as opposed to about nine of 30 on the complete CPI. There are other interesting differences, such as China: While both rank China as high-risk, TI gives it a better rank and score, just below medium-risk, while TRACE ranks and scores it as a higher-risk jurisdiction. TRACE categorizes Nepal as medium-risk, while TI ranks it as high-risk. TI ranks and scores China and India more closely, with China leading, while TRACE has a wider gap between the two, with India leading.
How should companies treat discrepancies between the TRACE Matrix and CPI? The simple approach is to take the lower of the two scores. Companies may also opt to select the risk score that is most relevant to their investment or opportunity, based on the underlying methodology. More sophisticated compliance programs will factor the TRACE Matrix and CPI outcomes into a blended risk rating based on a bespoke model. In whatever case, the availability of objective and credible data provides a helpful starting point that companies should not overlook.


 Wendy L. Wysong is a partner at


![FCPA Enforcement Is Changing; What Does It Mean for Compliance Programs? [Q&A]](https://www.corporatecomplianceinsights.com/wp-content/uploads/2025/02/doj-sign-on-building-350x250.jpg)
